|
How to Use the Web-Based Report |
| Frequently Asked Questions (FAQ). |
|
This section describes the basic structure of this report, and how to
obtain information from its pages. If the information you need is not described
below or you are having difficulty navigating through this report, please
contact us  .
.
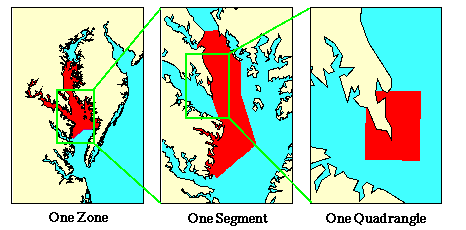
The SAV distribution and ground survey data are presented using three spatial scales. At the most broad scale, data are presented based on four zones: Upper Chesapeake Bay, Middle Chesapeake Bay, Lower Chesapeake Bay, and Delmarva Peninsula Coastal Bays. At a finer scale, data are presented based upon the 1998 Chesapeake Bay Program (CBP) segmentation scheme (78 segments), and five Delmarva Peninsula coastal bay segments. At the finest scale, the data are organized by USGS 7.5 minute quadrangles (See figure below).
Most web pages in this report are divided into several frames, including a banner,
left, and right frame. You can adjust the widths of the left and right
frames by clicking and dragging the vertical frame bar. In most browsers, to
print any frame (text or data), click on the frame to select it, then press your
browser's print button. For maps, click on the  to obtain a clear, printable version.
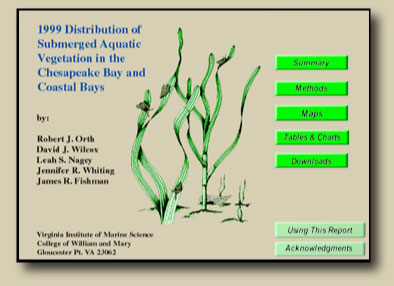
When you enter the report, you will see the front page shown below. The information in this report is divided into several sections. The Summary button describes the SAV distribution and abundance data results for the entire bay and each of the four zones. Clicking on the Methods button leads to a table of contents of pages that describe the methodology used. The Maps Button leads to an index of the available zone, segment, and quadrangle maps, along with the accompanying text descriptions and specific tabular data. The Tables & Charts button leads to an index of the various data tables and charts available. The Downloads button allows you to download PDF files of maps or GIS coverages. The Using This Report section leads to this help page. The Acknowledgments button displays the various granting agencies involved with this project, as well as acknowledgments to all who aided in this project.
The top of each page in this report contains the same banner. Several drop-down menus allow you to navigate between text, maps, or tables from any page in the report. Links to the funding agencies are also accessible by clicking on the logos.
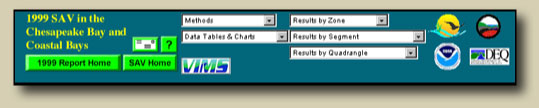
Methods selection menu: This menu provides easy access to the chapters in the Methods section of the report. The "Methods" menu in the banner can always be used to navigate between chapters. Selecting "Index" from the pull down menu will lead to a table of contents of the various methods used in this project.
Data Tables and Charts menu: This menu provides direct access to detailed SAV data and SAV area tabulations. Selecting "Index" will lead to a table of contents of the various tables and figures available.
Results menus: Three menus allow you to select text descriptions, tables, and maps for Chesapeake Bay and Coastal Bay zones, segments, or quadrangles. The first selection in each pull-down menu displays a map of the entire Bay to assist in selecting specific zones, segments or quadrangles.
Also on the banner are the following links:
 Link to the cover page of
the report.
Link to the cover page of
the report. Link to the Virginia Institute of
Marine Science SAV Program home page
Link to the Virginia Institute of
Marine Science SAV Program home page Link to this help page.
E-mail the SAV program at VIMS.
Link to this help page.
E-mail the SAV program at VIMS. Link to the Virginia Institute of Marine Science home
page.
Link to the Virginia Institute of Marine Science home
page. Link to the Environmental Protection Agency
Chesapeake Bay Program home page.
Link to the Environmental Protection Agency
Chesapeake Bay Program home page. Link to the National Oceanic and Atmospheric Administration.
 Link to Maryland Department of Natural
Resources.
Link to Maryland Department of Natural
Resources. Link to Virginia Department of Environmental
Quality.
Link to Virginia Department of Environmental
Quality.Each page of the Methods section has two frames. The frame on the
right contains the text while the frame on the left provides a table of contents
listing each chapter. You can navigate between chapters by clicking on the
chapter heading in the table of contents, by using the  and
and  buttons on each page, or by using the
banner.
buttons on each page, or by using the
banner.
Links in the the text provide access to figures, photos, tables, and maps, either as a new page in the same window, or will show up in a new window on your screen. Some photos have close-up views available, which can be viewed by clicking in the zoom box on the photo. To return to the text, click the browser's "back" button, or close the new window.
The Results section is divided into three parts: zone maps, segment maps, and quadrangle maps.
The Zone index map allows you to choose which zone to view. Clicking on any of the zones on the map or in the left frame will bring up a close-up map of that zone (which is highlighted) along with the relevant data. You can zoom in by either clicking on the map or by using the Zoom buttons. Shaded areas on these maps signify areas of partial data. Quadrangle lines are also visible on this map, however to view a specific quadrangle, you must use the banner to select a specific quadrangle or to select a quadrangle from a map.
The Segment index map allows you to choose which segment to view by either clicking on the segment on the map in the right frame, or clicking on the segment name in the left frame. Segments can be listed either alphabetically or geographically by clicking the appropriate button on the left frame.
Selecting a segment will bring up a Detailed Segment Map similar to the one reproduced below:
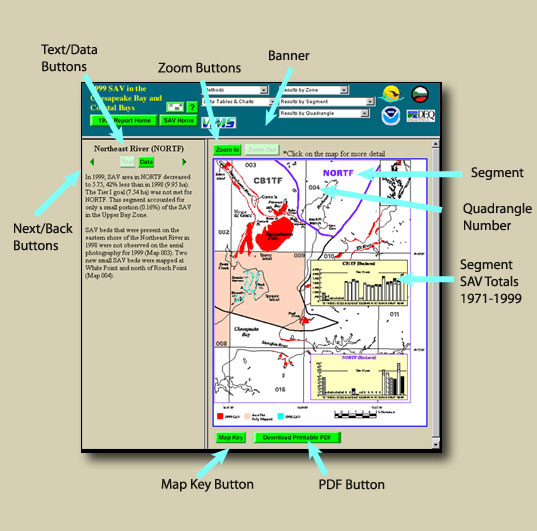
On the left frame of the detailed segment map, the  button switches the left frame to a textual description of the SAV distribution in
the segment. Places that are referenced in the text are
labeled on the detailed quadrangle maps and where possible on the detailed
segment map. The
button switches the left frame to a textual description of the SAV distribution in
the segment. Places that are referenced in the text are
labeled on the detailed quadrangle maps and where possible on the detailed
segment map. The  button switches the left frame to tabular data for the segment, including tables of SAV area by quadrangle within
the segment for 1998, 1999 and the change, as well as density breakdown for
1998 and 1999, and ground survey species information. Two
"Next/Back" arrows allow you to navigate to adjacent
segments. The map in the right frame displays
several segments, including the
segment of interest, which is highlighted. Areas that are shaded signify
regions of partial data. Column charts on the map show the area of SAV in that segment
by year and by density class from the first time the segment was mapped up to 1999. A key to the map can
be seen by clicking the
button switches the left frame to tabular data for the segment, including tables of SAV area by quadrangle within
the segment for 1998, 1999 and the change, as well as density breakdown for
1998 and 1999, and ground survey species information. Two
"Next/Back" arrows allow you to navigate to adjacent
segments. The map in the right frame displays
several segments, including the
segment of interest, which is highlighted. Areas that are shaded signify
regions of partial data. Column charts on the map show the area of SAV in that segment
by year and by density class from the first time the segment was mapped up to 1999. A key to the map can
be seen by clicking the  button. To zoom in or out from several scales of view, either click on the map, or
use the
button. To zoom in or out from several scales of view, either click on the map, or
use the  or
or  buttons above the map. A printable version
can be downloaded by clicking the
button. On each segment map, individual quadrangles are
visible, which can be viewed in detail by clicking on the quadrangle.
buttons above the map. A printable version
can be downloaded by clicking the
button. On each segment map, individual quadrangles are
visible, which can be viewed in detail by clicking on the quadrangle.
The Quadrangles Index Map allows you to chose a quadrangle by clicking it on the map, or by clicking on the quadrangle name in the left frame. For individual quadrangles, the right frame contains the Detailed Quadrangle Map, and the left frame contains tabular data including individual bed areas, density breakdown, species lists, and ground survey results. Beds are uniquely identified through letters and numbers. The numbers signify the Density class (e.g. bed "A2" signifies a bed of density class 2). Species and surveyor links in the ground survey table lead to a table of species abbreviations and surveyor symbols. By default, the 1999 SAV distribution is shown.
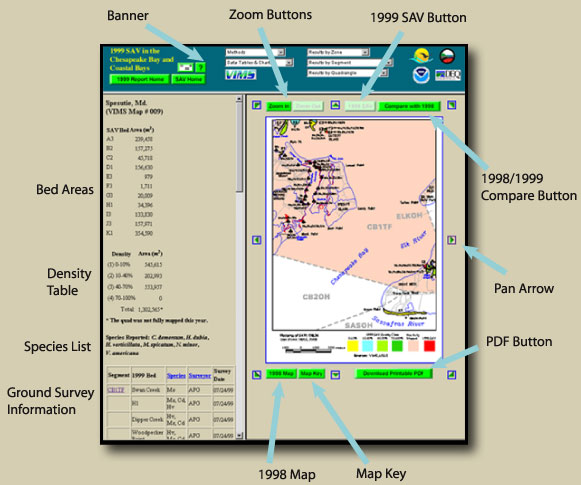
To zoom in or out from three scales of view, either click on the map, or
use the
or
buttons above the map. Pan arrows at the corners
and sides of the map allow you to navigate to adjacent
quadrangles. The map displays the 1999 SAV distribution using colors that signify
different densities (the color legend is at the bottom of the
map). In many maps, a shaded portion is visible, which signifies partial
data regions.
The  button will display the same map
with the 1998 and 1999 SAV distribution, color coded so that SAV gain, loss,
or no change between the two years is evident . You can zoom in or out
with this map as well.
button will display the same map
with the 1998 and 1999 SAV distribution, color coded so that SAV gain, loss,
or no change between the two years is evident . You can zoom in or out
with this map as well.
The  button opens a new window with 1998 SAV data for the same quadrangle, and
provides access to maps from other previous years. The
button displays a key to the map symbols, species abbreviations, and colors
in a new window. A printable version
can be downloaded by clicking the button.
button opens a new window with 1998 SAV data for the same quadrangle, and
provides access to maps from other previous years. The
button displays a key to the map symbols, species abbreviations, and colors
in a new window. A printable version
can be downloaded by clicking the button.
This section is structured similar to the Methods section. The frame on the right contains the table or chart while the frame on the left contains a table of contents. You can navigate between pages by clicking on the heading in the table of contents frame, or by using the banner.
This section allows you to download entire sets of segment and quadrangle maps as well as GIS coverages. The maps are in PDF format.