SAV Home
About SAV
SAV in the Bay
Bibliography
Special Reports
Reports
2018
2017
2016
2015
2014
2013
2012
2011
2010
2009
2008
2007
2006
2005
2004
2003
2002
2001
2000
1999
1998
1997
1995
1994
1992
1991
1989
1987
1986
1985
1984
1978-1981
1978
Maps & Data
2019 Maps
2018 Maps
2017 Maps
2016 Maps
2015 Maps
2014 Maps
2013 Maps
2012 Maps
2011 Maps
2010 Maps
2009 Maps
2008 Maps
2007 Maps
2006 Maps
Interactive Map
GIS Data
Tables
Quad Area
Bed Area
Segment Area
Segment Area by Quad
Segment Density
Zone Density
Segment Area by State
Ground Survey
Species by Segment
Charts
Segment Area
Segment Density
Zone Area
Zone Compare
Bay Area
Ground Survey
Aerial & Field SAV Observations
Historic Field SAV Observations
Ground Survey Spreadsheet Guidelines
Photo Gallery
2008
2007
2006
2005
2004
Restoration
SAV Home
>
2010 SAV Report
>
Lists and Figures
>
Segment Comparision
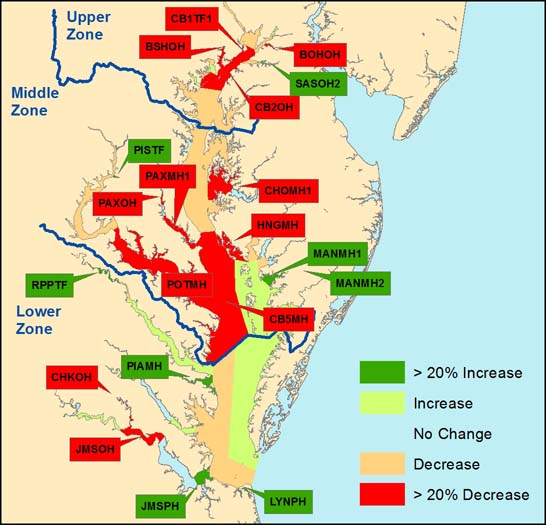
Map of Chesapeake Bay and its tributaries showing changes in SAV abundance by segment and zone (Upper, Middle, and Lower) in 2010.
2010 SAV Report
Executive Summary
Methods
Organizational Procedures
SAV Species
Aerial Photography
Mapping Process
Calculation of Area
Ground Surveys
Literature Cited
Species and Ground Surveyors Key
Lists and Figures
Results
Interactive Map
Quad Maps
Tables
Charts
GIS Data
Acknowledgments
SAV Home
Contact Us
VIMS Home
SAV Links