|
||||||||||||||||||||||||||||||||||||||||||||||||||||||||||||||||||||||||||||||||||||||||||||||||||||||||
|
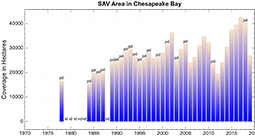
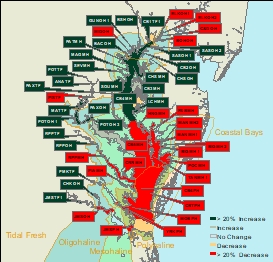
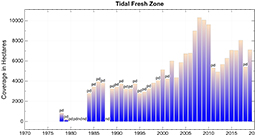
The 2019 distribution of submerged aquatic vegetation (SAV) in Chesapeake Bay and its tributaries was mapped from aerial multispectral digital imagery. These were acquired between May and September 2019, with a resolution of 24 cm, encompassing 193 flight lines. WorldView 2 satellite imagery acquired from Digital Globe through the NGA NextView program was used to augment the aerial imagery for the Belmont Bay portion of the Potomac River. CHESAPEAKE BAY For 2019, 26,865 hectares (66,387 acres) of SAV were mapped in Chesapeake Bay and its tributaries. Although the Chesapeake Bay and its tributaries were fully mapped for 2019, highly turbid water, weather conditions, and security restrictions in the DC area, over Patuxent Air Base and associated mid-Bay areas prevented acquisition of useable imagery in 2018 for a portion of the tidal fresh and mesohaline Potomac River; the Bohemia, Choptank, and Mattaponi rivers. In order to ensure a valid analysis of change in SAV distribution and abundance with 2018, all direct comparisons to previous years in this report are restricted to only those regions that were mapped in both years. If a region was not mapped in 2018, comparisons are given using area totals from 2017 instead. The area that was not fully mapped in 2018 supported 1,760 ha of SAV in 2019 (4,348 acres, 7% of the 2019 Bay total). Notable changes in SAV distribution were measured between 2019 and 2018. SAV decreased 37% from 39,993 ha (98,828 ac) in 2018 to 25,106 ha (62,038 ac) in 2019 in the regions mapped for both years. SAV modestly increased in the Tidal Fresh and Oligohaline salinity zones and sharply decreased in the Mesohaline and Polyhaline salinity zones in the Chesapeake Bay. In 2019, SAV increased in 41, decreased in 28, and remained unvegetated in 24 of the 93 CBP segments. The largest declines in terms of total area (-13,315 hectares, 32,903 ac) were observed in the Mesohaline zone particularly in the Tangier Sound area (-7,467 hectares, 18,452 ac). Losses are largely due to declines in widgeongrass which is prone to boom and bust cycles of expansion and retraction. In 2018, the Mesohaline and northern Polyhaline salinity zones widgeongrass increased and eelgrass was observed by the survey for the first time in an extensive region east of Tangier Island. The subsequent decline we observed in 2019 mirrors a similar rapid increase in widgeongrass in 2001 and 2002 that was followed by about a 50% decline in 2003. Tidal Fresh Bay Salinity Zone In the Tidal Fresh Bay Zone (19 CBP segments), 7,113 hectares (17,577 ac) of SAV were mapped for 2019. Portions of the zone, including the Mattaponi River and the portion of the Potomac River from Belmont Bay through the DC area including the Anacostia River, representing 1,124 ha of SAV in 2019 (2,776 ac, 16% of the zone total) were not mapped for 2018. Comparing the same mapped regions between 2018 and 2019, SAV increased 11% from 5,420 hectares (13,393 ac) in 2018 to 5,989 hectares (14,800 ac) in 2019. 8 of the 19 segments increased by at least 20% and by at least 5 ha from 2018 totals.
1 of the 19 segments decreased by at least 20% and by at least 5 ha from 2018 totals.
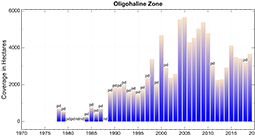
4 of the 19 segments remained unvegetated in 2018. *Segment comparison restricted to areas mapped in both 2018 and 2019 Oligohaline Bay Salinity Zone In the Oligohaline Bay Zone (25 CBP segments), 3,648 hectares (9,014 acres) of SAV were mapped for 2019. However, portions of the zone, including the Potomac, Bohemia, and Sassafras Rivers, representing 28 ha of SAV in 2019 (70 ac, 1% of the zone total) were not mapped for 2018. Comparing the same mapped regions between 2018 and 2019, SAV increased 13% from 3,195 hectares (7,895 ac) in 2018 to 3,620 hectares (8,944 ac) in 2019. 12 of the 25 segments increased by at least 20% and by at least 5 ha from 2018 totals.
6 of the 25 segments decreased by at least 20% and by at least 5 ha from 2018 totals.
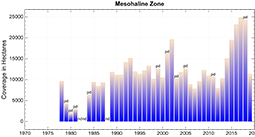
3 of the 25 segments remained unvegetated in 2018. * Segment comparison restricted to areas mapped in both 2018 and 2019 Mesohaline Bay Salinity Zone In the Mesohaline Bay Salinity Zone (41 CBP segments), 11,310 hectares (27,947 ac) of SAV were mapped for 2019. Portions of the zone, including the north shore of the Potomac River from Herring Creek to Smith Creek, those creeks, and the St. Marys River, and portions of the Choptank and Honga Rivers, representing 608 ha of SAV in 2019 (1,502 ac, 5% of the zone total) were not mapped for 2018. Comparing the same mapped regions between 2018 and 2019, SAV decreased 55% from 24,017 hectares (59,348 ac) in 2018 to 10,702 hectares (26,445 ac) in 2019. 8 of the 41 segments increased by at least 20% and by at least 5 ha from 2018 totals:
12 of the 41 segments decreased by at least 20% and by at least 5 ha from 2018 totals:
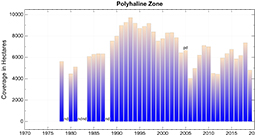
16 of the 41 segments remained unvegetated in 2019. * Segment comparison restricted to areas mapped in both 2018 and 2019 Polyhaline Bay Salinity Zone In the Polyhaline Bay Zone (8 CBP segments), SAV decreased 35% from 7,362 ha (18,192 ac) in 2018 to 4,795 ha (11,849 ac) in 2019. None of the 8 segments increased by at least 20% and by at least 5 ha from 2018 totals. 5 of the 8 segments decreased by at least 20% and by at least 5 ha from 2018 totals.
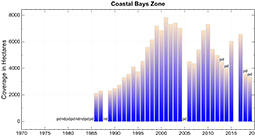
1 of the 8 segments remained unvegetated in 2018. Delmarva Peninsula Coastal Bays Zone In the Delmarva Peninsula Coastal Bays Zone (10 segments covering Assawoman, Isle of Wight, Sinepuxent, Chincoteague, and Southern Virginia coastal bays), 3,358 hectares (8,297 ac) of SAV were mapped for 2019. However, the northern portion of the zone, including Chincoteague Bay and Maryland coastal bays, representing 3,641 ha of SAV in 2017 (8,996 ac, 55% of the zone total) was not mapped for 2019. Comparing the same mapped regions between 2018 and 2019, SAV decreased 7% from 3,613 hectares (8,927 ac) in 2018 to 3,358 hectares (8,297 ac) in 2019. None of the 10 segments increased or decreased by at least 20% and by at least 5 ha from 2018 totals Four of the 10 segments remained unvegetated in 2019. |
