|
||||||||||||||||||||||||||||||||||||||||||||||||||||||||||||||||||||||||
|
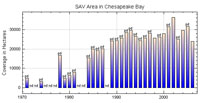
The distribution of submerged aquatic vegetation (SAV) in Chesapeake Bay, its tributaries, and the Maryland and Virginia coastal bays of the Delmarva Peninsula, was mapped from black and white aerial photographs. These were taken between June and October 2007, at a scale of 1:24,000, encompassing 181 flight lines. CHESAPEAKE BAY For 2007, 26,271 hectares (64,917 acres) of SAV were mapped in Chesapeake Bay and its
tributaries. Notable changes in SAV distribution were measured between 2006 and 2007. SAV increased 10% from 23,941 ha (59,160 ac) in 2006 to 26,271 ha (64,917 acres) in 2007. SAV increased in two (Upper and Lower) and decreased in one (Middle) geographic zone delineated for Chesapeake Bay. In 2007, SAV increased in 31, decreased in 27, and remained unvegetated in 35 of the 93 CBP segments. Upper Bay Zone In the Upper Bay Zone (21 CBP segments extending south from the Susquehanna River to the Chester and Magothy rivers), SAV increased 22% from 6,286 ha (15,532 ac) in 2006 to 7,658 ha (18,922 ac) in 2007. Six of the 21 segments increased by at least 20% and by at least 5 ha from 2006 totals:
Six of the 21 segments decreased by at least 20% and by at least 5 ha from 2006 totals.
Three of the 21 segments remained unvegetated. Middle Bay Zone In the Middle Bay Zone (44 CBP segments extending south from the Bay Bridge to the Rappahannock River and Pocomoke Sound, and including the Potomac River), SAV decreased 2% from 12,407 ha (30,659 ac) in 2006 to 12,137 ha (29,992 ac) in 2007. Four of the 44 segments increased by at least 20% and by at least 5 ha from 2006 totals:
Eight of the 44 segments decreased by at least 20% and by at least 5 ha from 2006 totals:
Twenty of the 44 segments remained unvegetated. Lower Bay Zone In the Lower Bay Zone (28 CBP segments covering the region south from the Rappahannock River and Pocomoke Sound regions to the mouth of the Bay), SAV increased 23% from 5,248 ha (12,969 ac) in 2006 to 6,476 ha (16,004 ac) in 2007. Seven of the 28 segments increased by at least 20% and by at least 5 ha from 2006 totals:
None of the 28 segments decreased by at least 20% and by at least 5 ha from 2006 totals. Twelve segments remained unvegetated in 2007. DELMARVA PENINSULA COASTAL BAYS ZONE In the Delmarva Peninsula Coastal Bays Zone (Assawoman, Isle of Wight, Sinepuxent, Chincoteague, and Southern Virginia coastal bays), SAV decreased 4% from 4,524 ha (11,1179 ac) to 4,362 ha (10,470 ac) in 2007. Two of the five segments increased since 2006:
Three of the five segments decreased since 2006:
|
