|
||||||||||||||||||||||||||||||||||||||||||||||||||||||||||
|
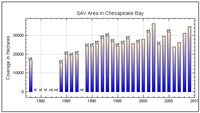
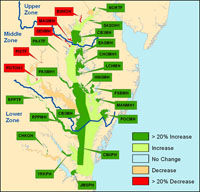
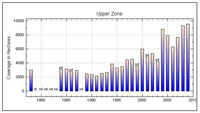
The distribution of submerged aquatic vegetation (SAV) in Chesapeake Bay and its tributaries in 2009 was mapped from black and white aerial photographs. These were taken between May and November 2009, at a scale of 1:24,000, encompassing 173 flight lines. CHESAPEAKE BAY For 2009, 34,768 hectares (85,914 acres) of SAV were mapped in Chesapeake Bay and its tributaries. Notable changes in SAV distribution were measured between 2008 and 2009. SAV increased 12% from 31,104 ha (76,860 ac) to 34,768 ha (85,914 ac). SAV increased in all three (Upper, Middle, and Lower) geographic zones delineated for Chesapeake Bay for the second time since 2001. In 2009, SAV increased in 40, decreased in 18, and remained unvegetated in 35 of the 93 CBP segments. The 3,664 ha increase in baywide SAV coverage occurred primarily in the Middle (2,060 ha) and Lower (1,344 ha) bay zones. These changes reflect a large increase in widgeongrass in four segments in the Middle Bay Zone (Lower Central Chesapeake Bay, Honga River, Pocomoke Sound, and Eastern Bay) and in the Lower Rappahannock River segment in the Lower Bay Zone. The recovery of eelgrass following the 2005 dieback reflects the notable increases in Tangier Sound in the Middle Bay Zone as well as Eastern Lower Chesapeake Bay and Mobjack Bay segments in the Lower Bay Zone. This is the third year of SAV increase in the Lower Bay Zone since the eelgrass dieback. Total area in the Upper Bay Zone remains relatively unchanged from 2008 levels, although there were local offsetting shifts within the zone. The growth and persistence of the SAV bed in the Susquehanna Flats, one of the largest SAV beds in the Bay, continues to be a major success story for SAV recovery today. Upper Bay Zone In the Upper Bay Zone (21 CBP segments extending south from the Susquehanna River to the Chester and Magothy rivers), SAV increased 3% from 9,289 ha (22,953 ac) in 2008 to 9,549 ha (23,597 ac) in 2009. Three of the 21 segments increased by at least 20% and by at least 5 ha from 2008 totals:
Two of the 21 segments decreased by at least 20% and by at least 5 ha from 2008 totals.
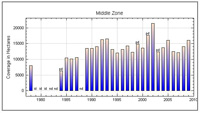
Three of the 21 segments remained unvegetated in 2009. Middle Bay Zone In the Middle Bay Zone (44 CBP segments extending south from the Bay Bridge to the Rappahannock River and Pocomoke Sound, and including the Potomac River), SAV increased 15% from 13,970 ha (34,521 ac) in 2008 to 16,030 ha (39,612 ac) in 2009. Ten of the 44 segments increased by at least 20% and by at least 5 ha from 2008 totals:
Three of the 44 segments decreased by at least 20% and by at least 5 ha from 2008 totals:
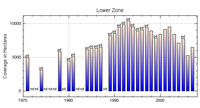
Twenty-one of the 44 segments remained unvegetated in 2009. Lower Bay Zone In the Lower Bay Zone (28 CBP segments covering the region south from the Rappahannock River and Pocomoke Sound regions to the mouth of the Bay), SAV increased 17% from 7,845 ha (19,386 ac) in 2008 to 9,189 ha (22,706 ac) in 2009. Six of the 28 segments increased by at least 20% and by at least 5 ha from 2008 totals:
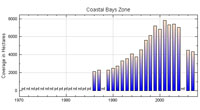
None of the 28 segments decreased by at least 20% and by at least 5 ha from 2008 totals. Eleven of the 28 segments remained unvegetated in 2009. DELMARVA PENINSULA COASTAL BAYS ZONE In the Delmarva Peninsula Coastal Bays Zone (Assawoman, Isle of Wight, Sinepuxent, Chincoteague, and Southern Virginia coastal bays), SAV increased 27% from 5,400 ha (13,344 ac) in 2008 to 6,862 ha (16,958 ac) in 2009. Four of the five segments increased since 2008:
One of the five segments decreased since 2008:
|
