|
||||||||||||||||||||||||||||||||||||||||||||||||||||||||||||||||||||||||||||||||||||||||||||
|
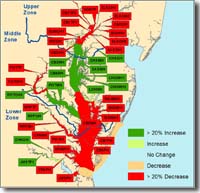
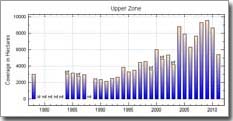
The 2011 distribution of submerged aquatic vegetation (SAV) in Chesapeake Bay and its tributaries was mapped from black and white aerial photographs. These were taken between May and December 2011, at a scale of 1:24,000, encompassing 160 flight lines. CHESAPEAKE BAY For 2011, 23,457 hectares (57,964 acres) of SAV were mapped in Chesapeake Bay and its tributaries. However, while the entire Bay was flown, some portions of the Bay were not mapped since SAV signatures were masked by excess turbidity present months after the passage of Hurricane Irene and Tropical Storm Lee. The regions that were not mapped are contained within nine CBP segments, including the Middle, Upper and Western Branch of the Patuxent River; the Middle and Upper Potomac River; Piscataway Creek; and the Anacostia River. These regions had 2,183 ha of SAV in 2010 (5,393 ac, 7% of the 2010 total). In order to ensure a valid analysis of change in SAV distribution and abundance given the reduced region mapped in 2011, all direct comparisons to previous years in this report are restricted to only those regions that were mapped in both years. Partial totals for 2010 have been computed for CBP segments, Bay zones, and the entire Bay using only those regions mapped for both years. Notable changes in SAV distribution were measured between 2010 and 2011. SAV decreased 22% from 30,056 ha (74,271 ac) to 23,346 ha (57,690 ac) in the regions mapped for both years. SAV decreased in all three (Upper, Middle, and Lower) geographic zones delineated for Chesapeake Bay. In 2011, SAV increased in 26, decreased in 34, and remained unvegetated in 33 of the 93 CBP segments. The 6,710 ha decrease in baywide SAV coverage in 2011 follows a 2,529 ha decrease in 2010. The 2011 decrease reflects strong declines in the Upper (3,264 ha) and Lower (2,918 ha) Bay zones, with a smaller decline in the Middle Bay zone (528 ha). Losses in the Lower Bay zone reflect the dieback of eelgrass in 2010 due to the extremely high summertime temperatures that occurred after these areas were surveyed in 2010. Some of the eelgrass loss was offset in the Middle Bay zone by a resurgence of widgeongrass, particularly in Eastern Bay and the Choptank River. Freshwater SAV species in the Upper Bay were strongly affected by Hurricane Irene and Tropical Storm Lee which increased river flow and sediment loads in this region for almost two months. Upper Bay Zone In the Upper Bay Zone (21 CBP segments extending south from the Susquehanna River to the Chester and Magothy rivers), SAV decreased 38% from 8,641 ha (21,353 ac) in 2010 to 5,377 ha (13,287 ac) in 2011. Three of the 21 segments increased by at least 20% and by at least 5 ha from 2010 totals:
Twelve of the 21 segments decreased by at least 20% and by at least 5 ha from 2010 totals.
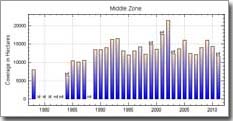
One of the 21 segments remained unvegetated in 2011. Middle Bay Zone In the Middle Bay Zone (44 CBP segments extending south from the Bay Bridge to the Rappahannock River and Pocomoke Sound, and including the Potomac River), 11,745 hectares (29,023 ac) of SAV were mapped for 2011. However, portions of the zone, including the Middle, Upper and Western Branch of the Patuxent River; the Middle and Upper Potomac; Piscataway Creek; and the Anacostia River, representing 2,183 ha of SAV in 2010 (5,393 ac, 15% of the zone total) were not mapped for 2011. Comparing the same mapped regions between 2010 and 2011, SAV decreased 4% from 12,162 hectares (30,053 ac) in 2010 to 11,634 hectares (28,749 ac) in 2011. Seven of the 44 segments (or mapped portions) increased by at least 20% and by at least 5 ha from 2010 totals:
Six of the 44 segments (or mapped portions) decreased by at least 20% and by at least 5 ha from 2010 totals:
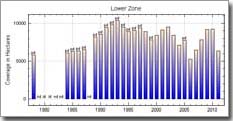
Twenty-one of the 44 segments remained unvegetated in 2011. Lower Bay Zone In the Lower Bay Zone (28 CBP segments covering the region south from the Rappahannock River and Pocomoke Sound regions to the mouth of the Bay), SAV decreased 32% from 9,253 ha (22,865 ac) in 2010 to 6,335 ha (15,654 ac) in 2011. Four of the 28 segments increased by at least 20% and by at least 5 ha from 2010 totals:
Nine of the 28 segments decreased by at least 20% and by at least 5 ha from 2010 totals.
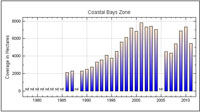
Eleven of the 28 segments remained unvegetated in 2010. * Segment comparison restricted to areas mapped in both 2010 and 2011 DELMARVA PENINSULA COASTAL BAYS ZONE In the Delmarva Peninsula Coastal Bays Zone (Assawoman, Isle of Wight, Sinepuxent, Chincoteague, and Southern Virginia coastal bays), SAV decreased 26% from 7,326 ha (18,102 ac) in 2010 to 5,445 ha (13,455 ac) in 2011. One of the five segments increased since 2010:
Four of the five segments decreased since 2010.
|
